DESIGNOSCOPE
TIMEFRAME
7 Weeks, Spring ’22
TEAM
Sammie Kim
Grace Li
Chelsea Liu
Kyungmin Kim
SKILLS
Figma Prototyping
UX/UI
Writing
7 Weeks, Spring ’22
TEAM
Sammie Kim
Grace Li
Chelsea Liu
Kyungmin Kim
SKILLS
Figma Prototyping
UX/UI
Writing
In 2019, Google and AIGA released the Design Census, a survey aimed to uncover the current state of the design industry. With 9,429 participants answering 38 questions, the Design Census serves as a vital tool for the understanding of the Design field, revealing many interesting facets of the profession—from demographic information to satisfaction levels to hopes and dreams.
To represent this data in a creative and approachable way, we created a web-based interaction where each constellation represents a designer in the census, and each star represents a data point. Drawing on this metaphor, we hope to tell the stories of the people that make up the design community compellingly while furthering the purpose of the AIGA’s Design Census: informing people about the Design landscape today.
MY ROLE
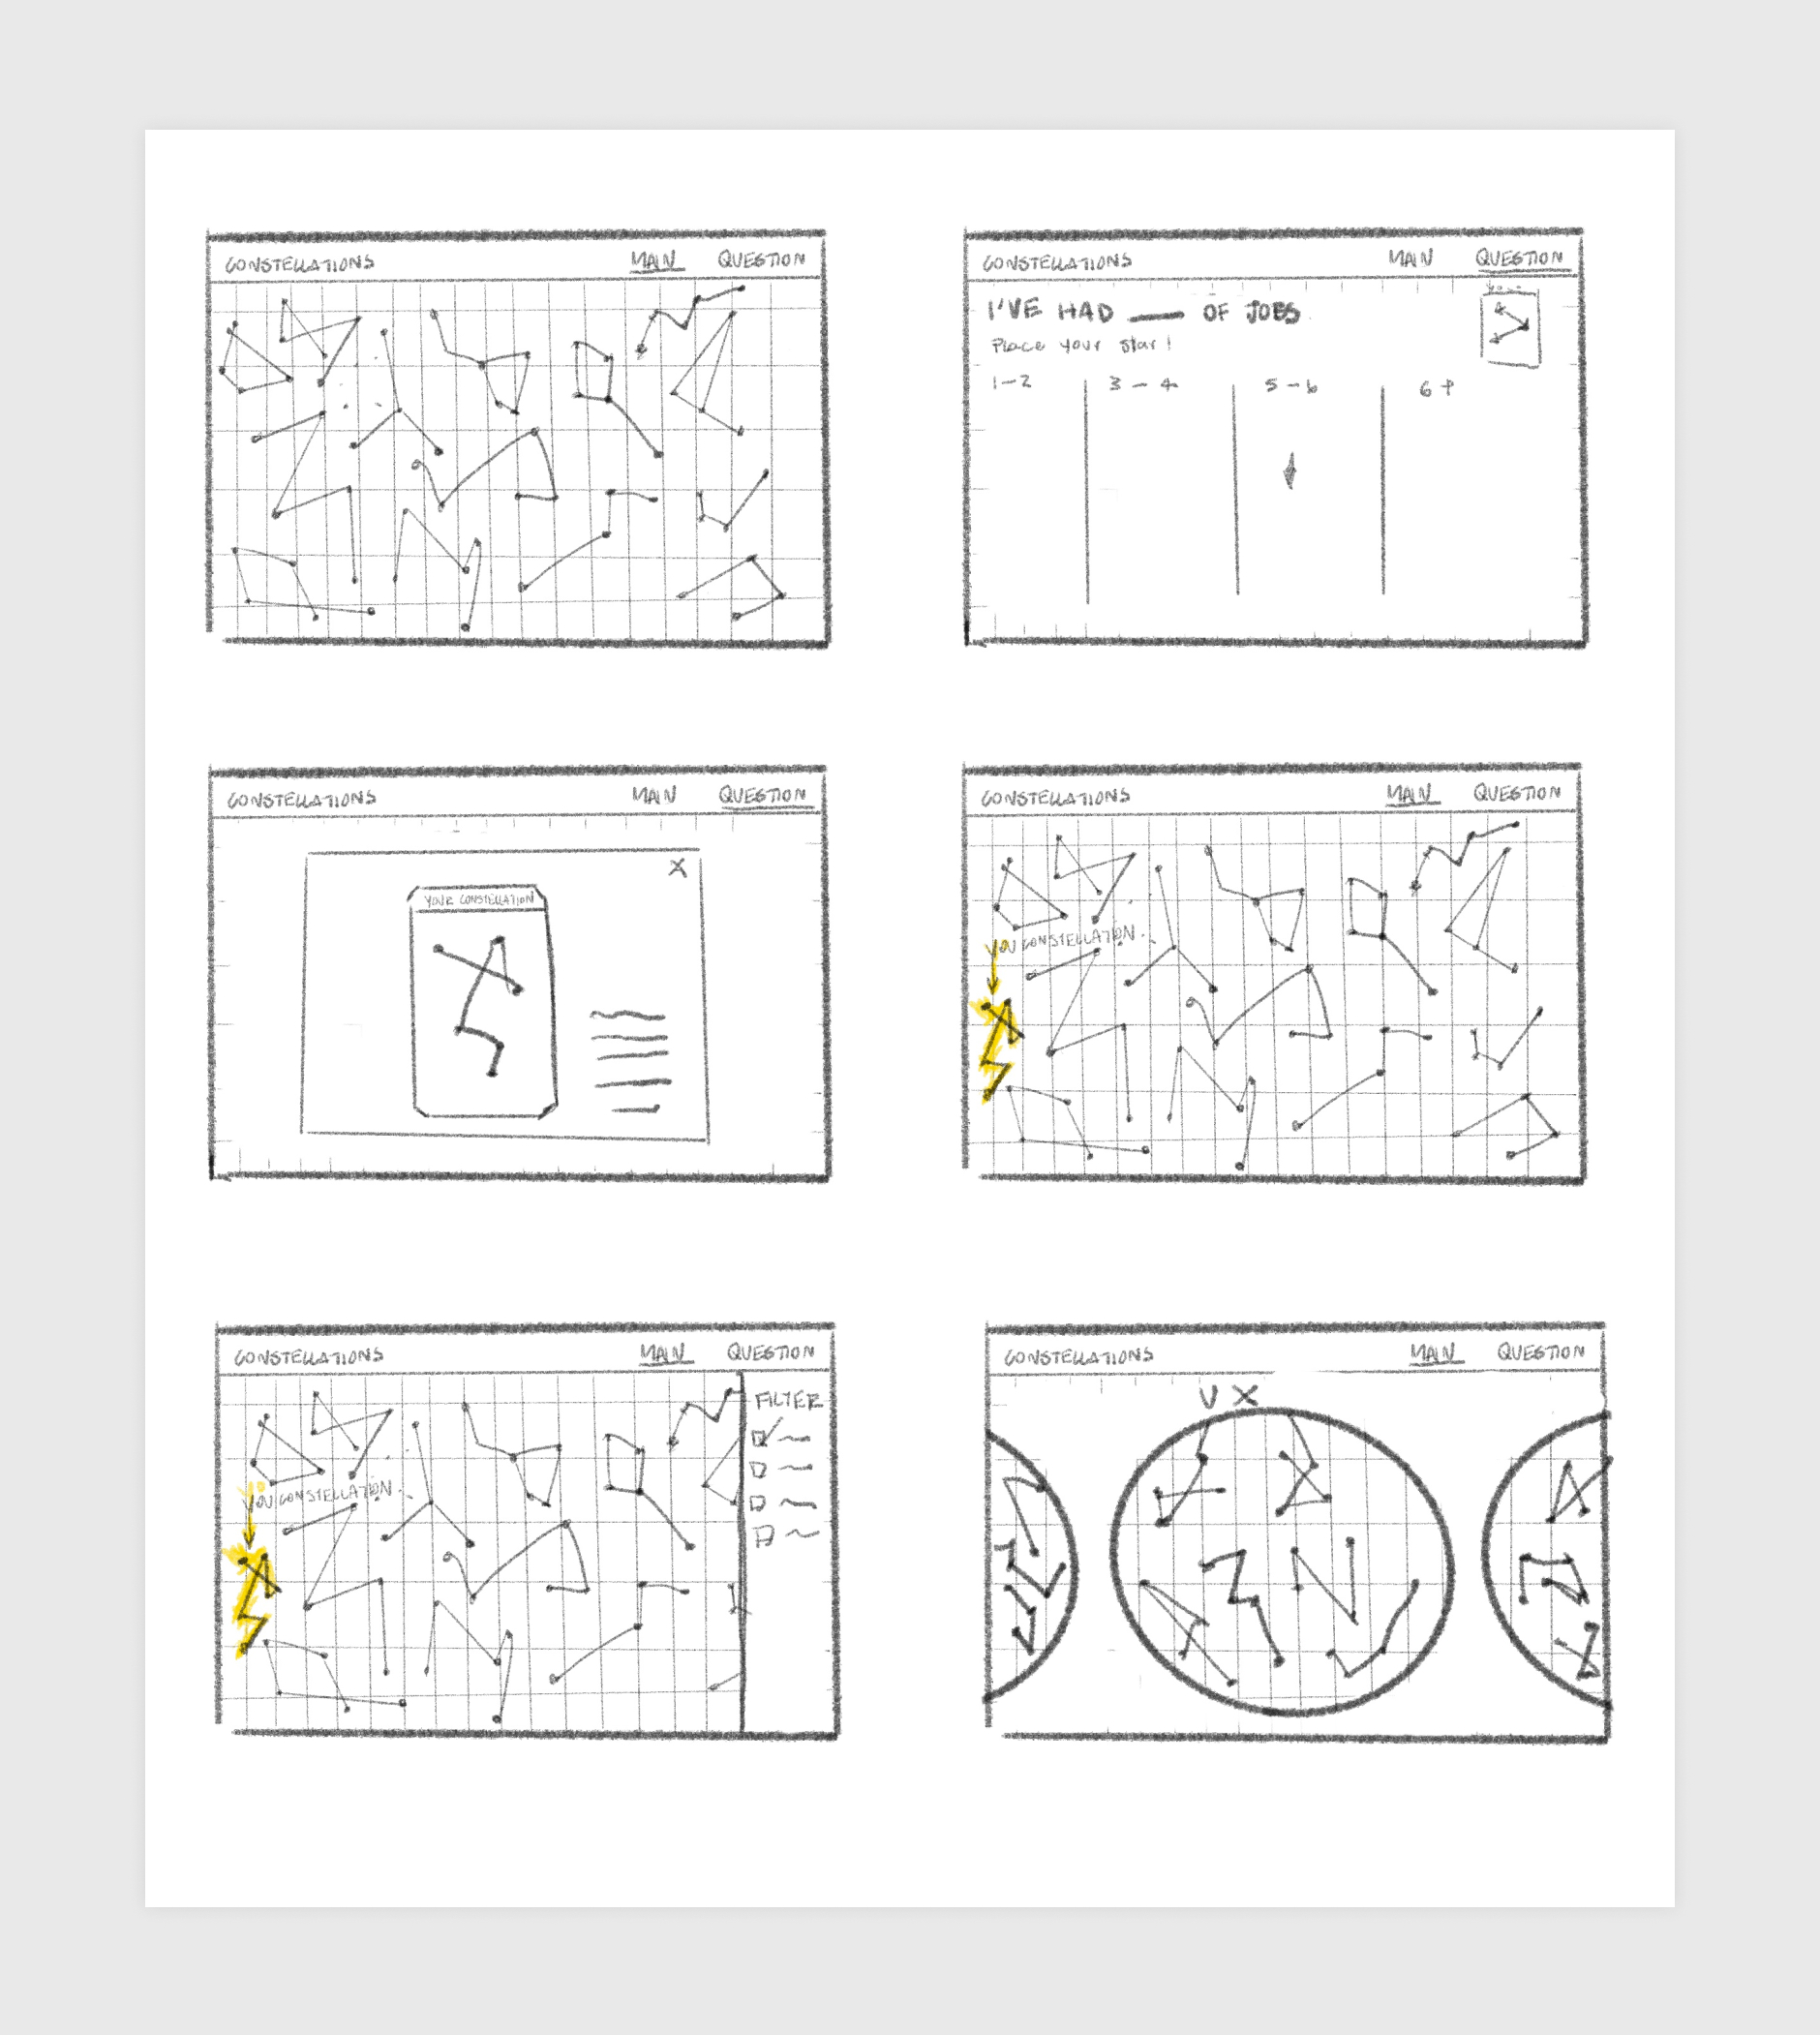
Apart from the concept development, which each member came up with 3-4 concept sketching, I was responsible for the design and prototype of the home page, which includes the constellation map and the fitlering system. I also took a secondary role in the creation of the design system—mainly deciding on the header typface—and the determination of the rules that govern the constellation forms.

RESEARCH
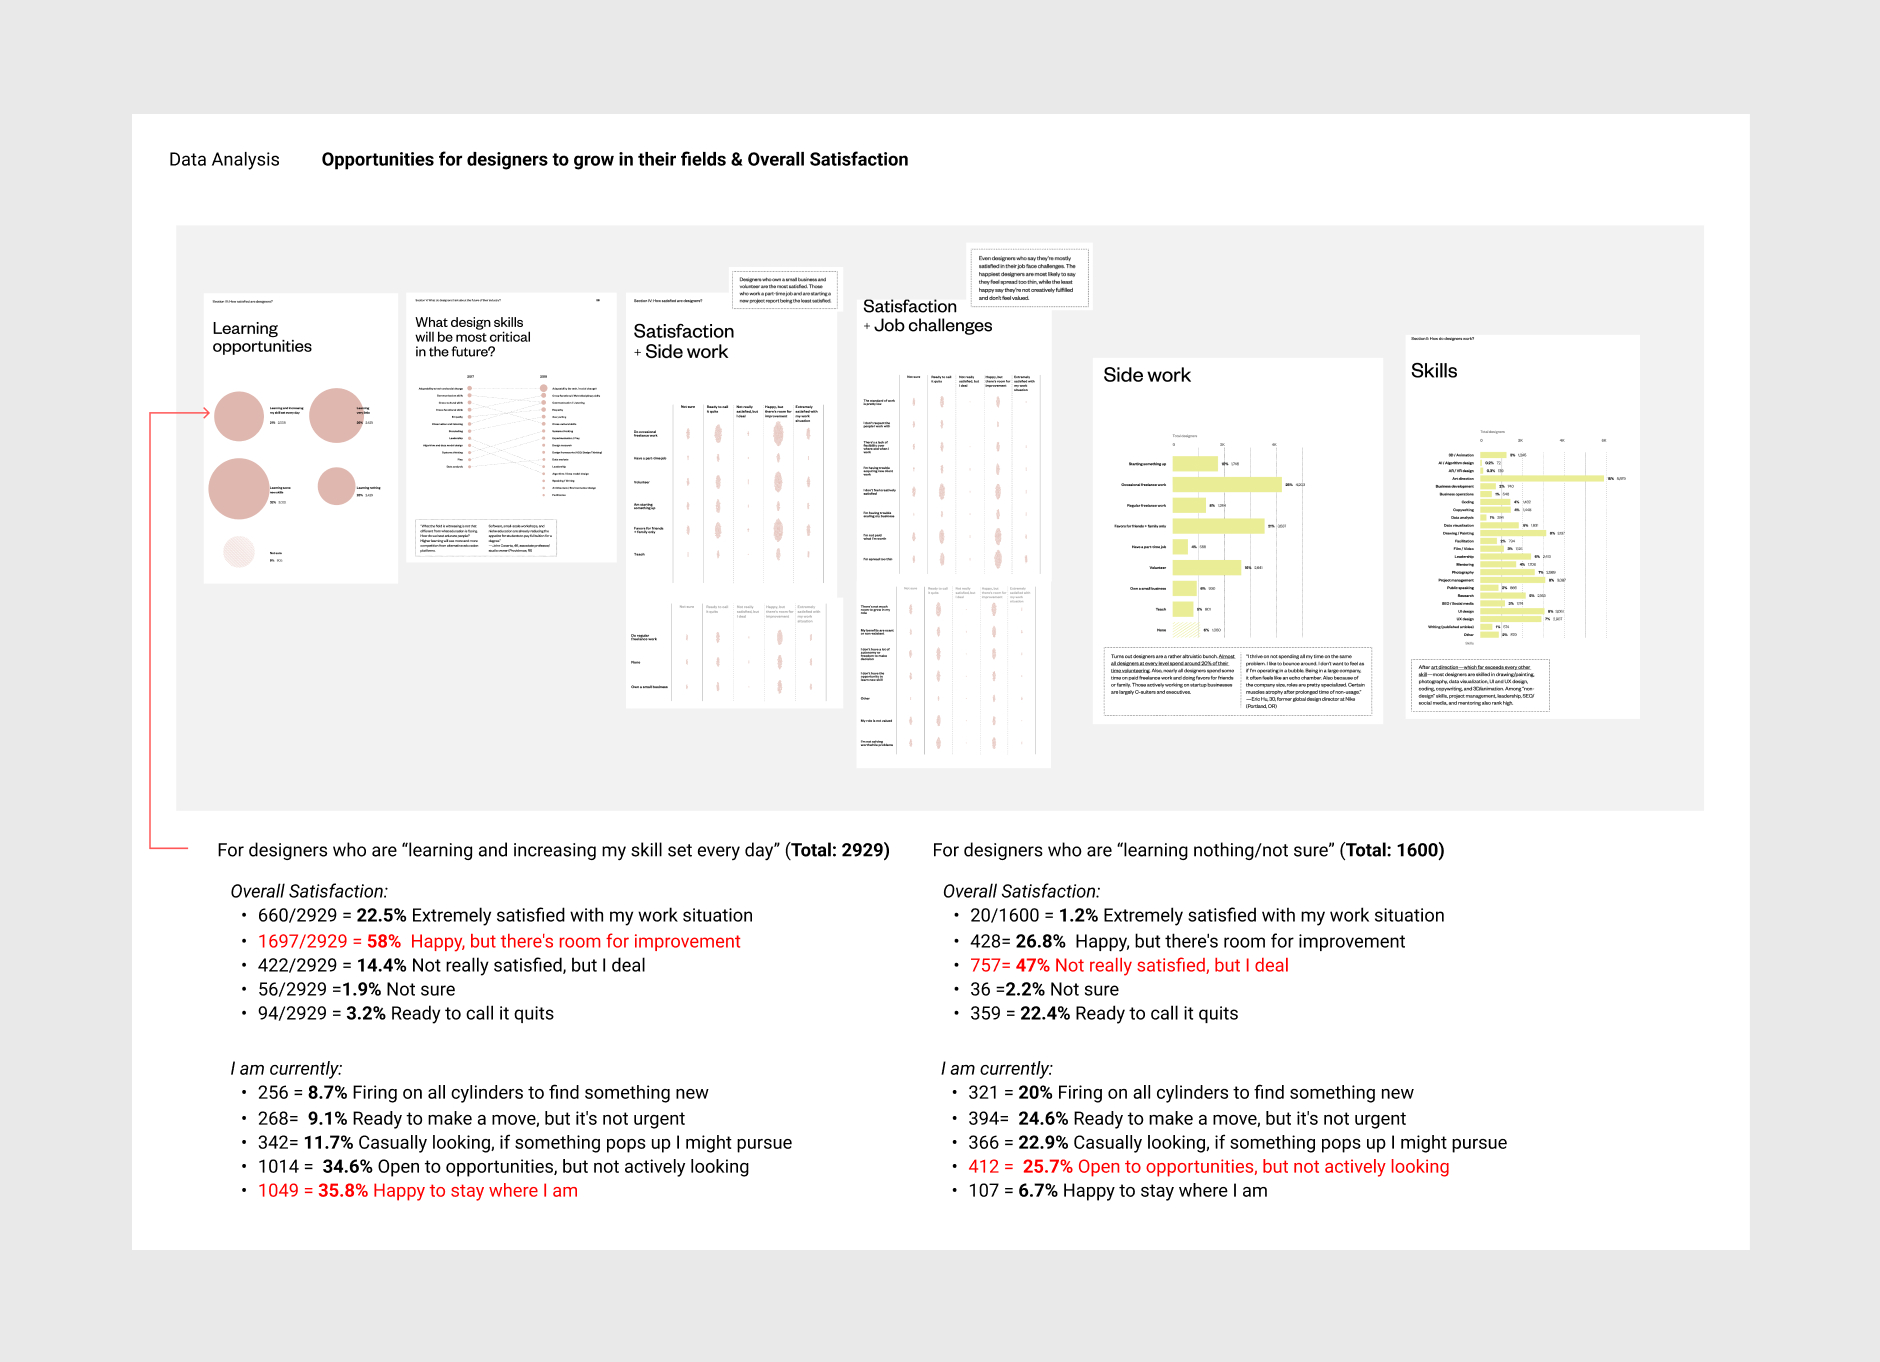
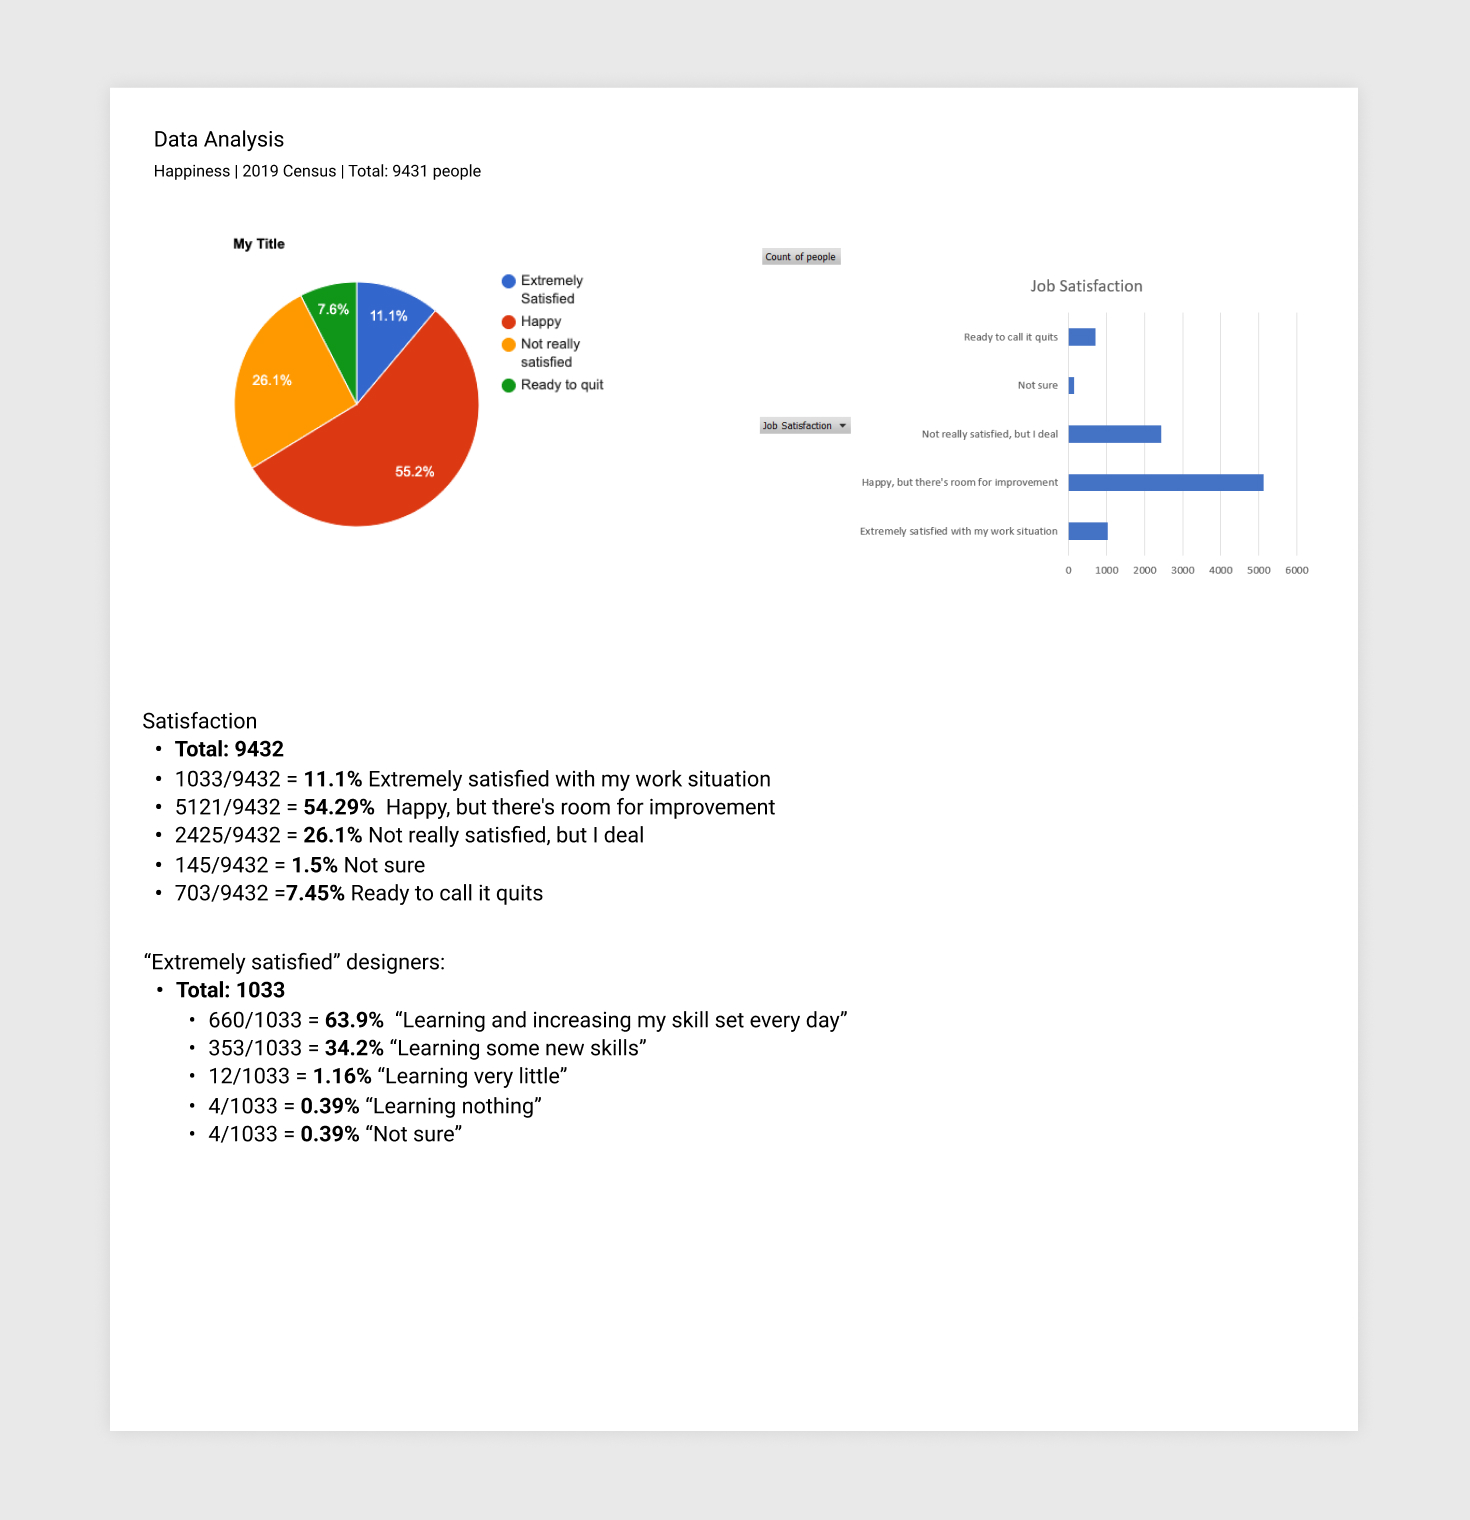
UNDERSTANDING THE DATASETOur preliminary research consisted of familiarizing ourselves with the data source. Parsing through the raw data CSV file and reading the AIGA Design Census report, we identified aspects of the data source that intrigued us. We were most interested in data related to the participants' journeys: their educational background, their current jobs, their industry, etc.

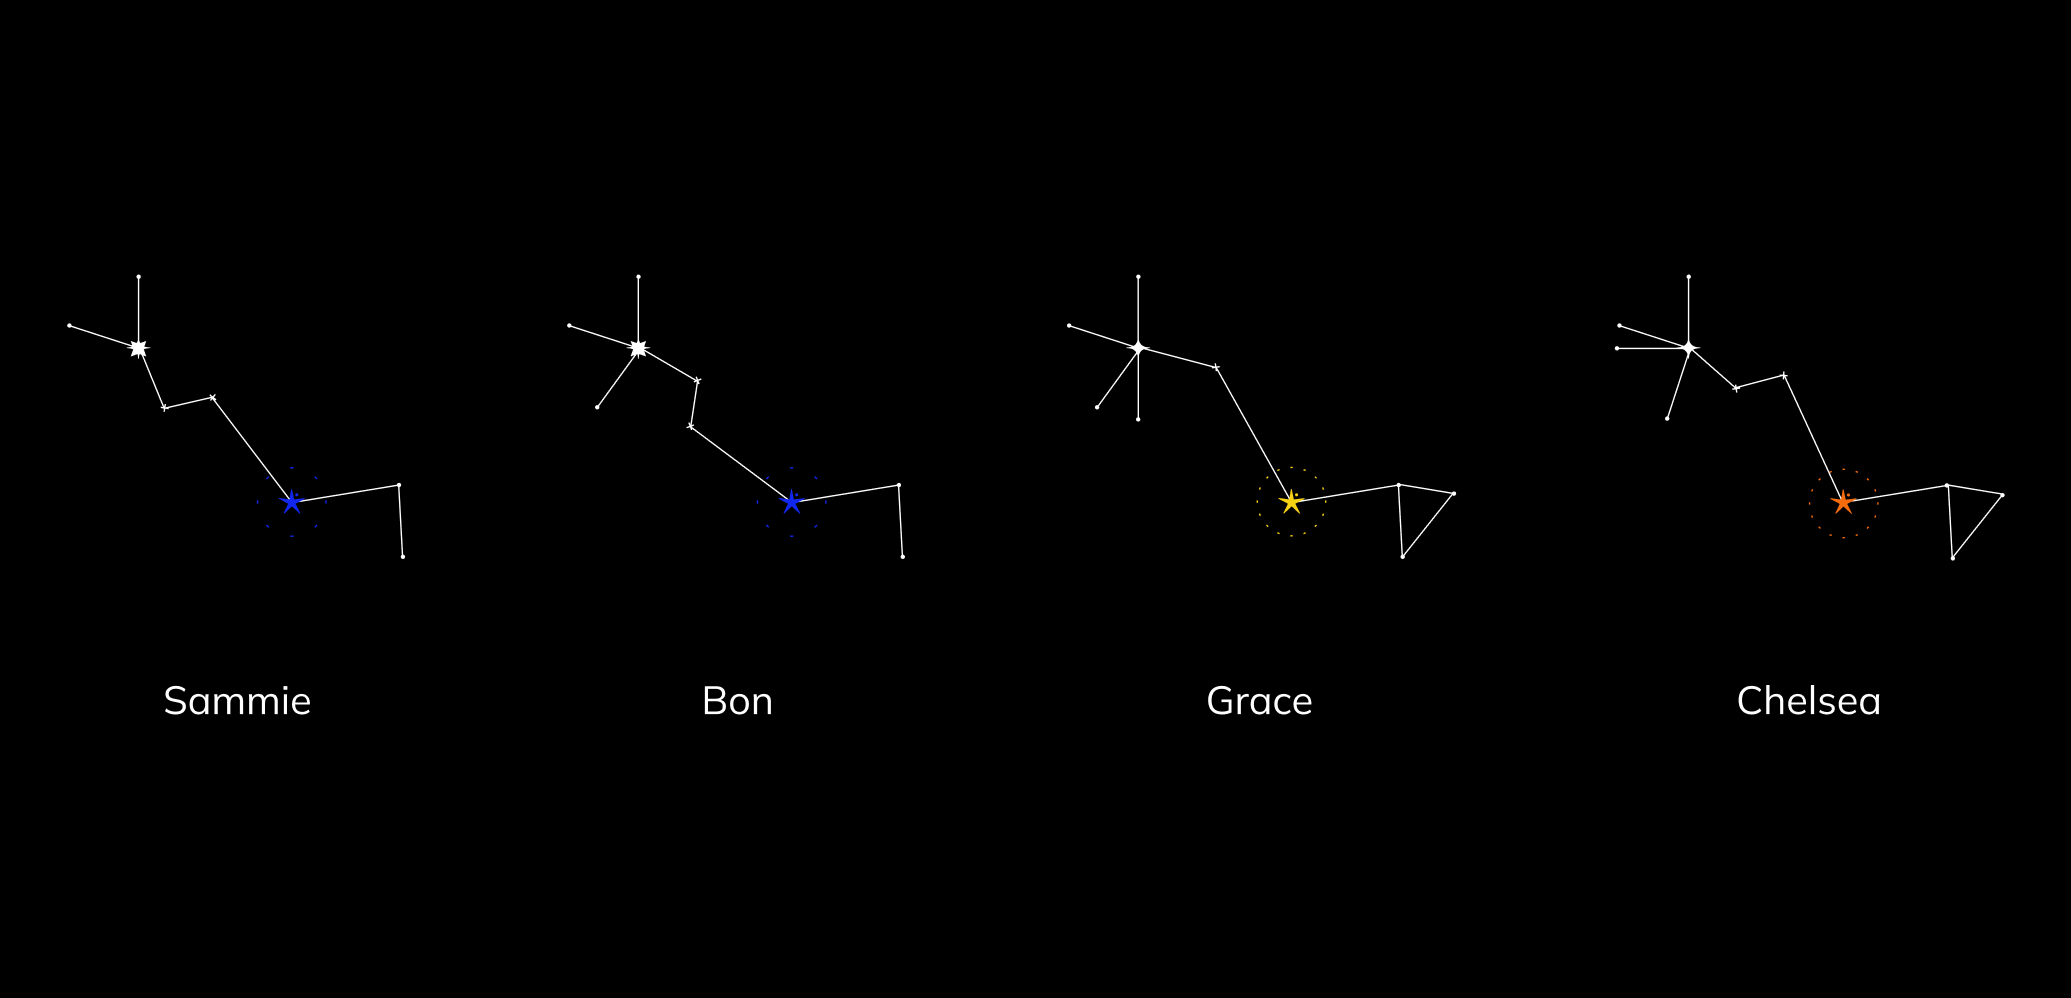
CONCEPT DEVELOPMENT
MAKING DATA APPROACHABLE THROUGH VISUAL METAPHORSFollowing our interest in the research phase, we decided that uncovering and examining various census participants’ career paths would be the focus of our project. After a brainstorming session, our group emerged with the design concept of comparing each participant's journey to a constellation. Drawing on the constellation metaphor, an idea tied to navigation, fate, the past, and the future, we would celebrate the diverse backgrounds and stories of designers who make up the design community in a playful and whimsical way.


SITE ARCHITECTURE
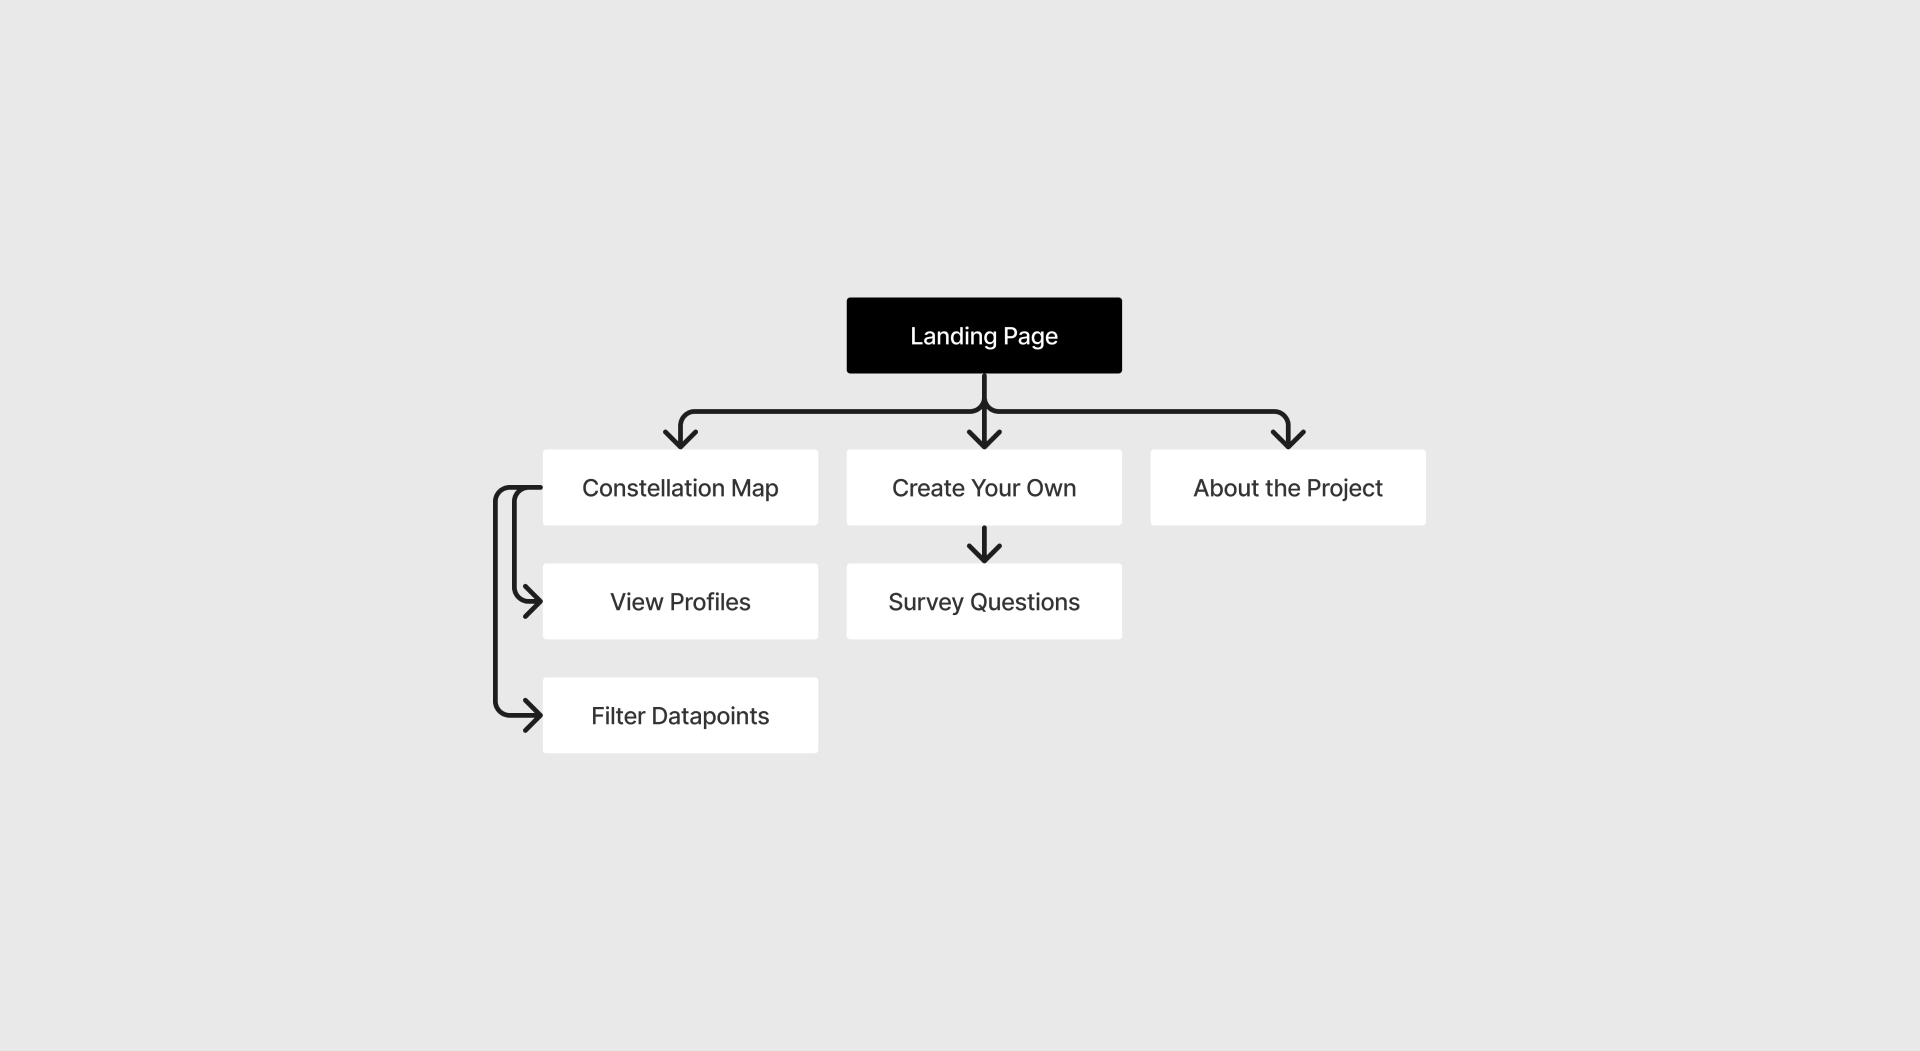
THINKING THROUGH THE INFORMATION STRUCTUREWith a direction in mind, our group started designing the Designoscope website. Based on the features and sketches during the brainstorming session, we diagramed a site architecture that allowed us to see how interactions and contents on the site would exist. Ultimately, the Designoscope website would include three features: 1. The ability to see the macro-view of the dataset through the constellation map 2. The ability to examine a specific constellation and observe the minutiae data points that make up the constellation 3. The ability to create one's constellation and contribute to the growing dataset.
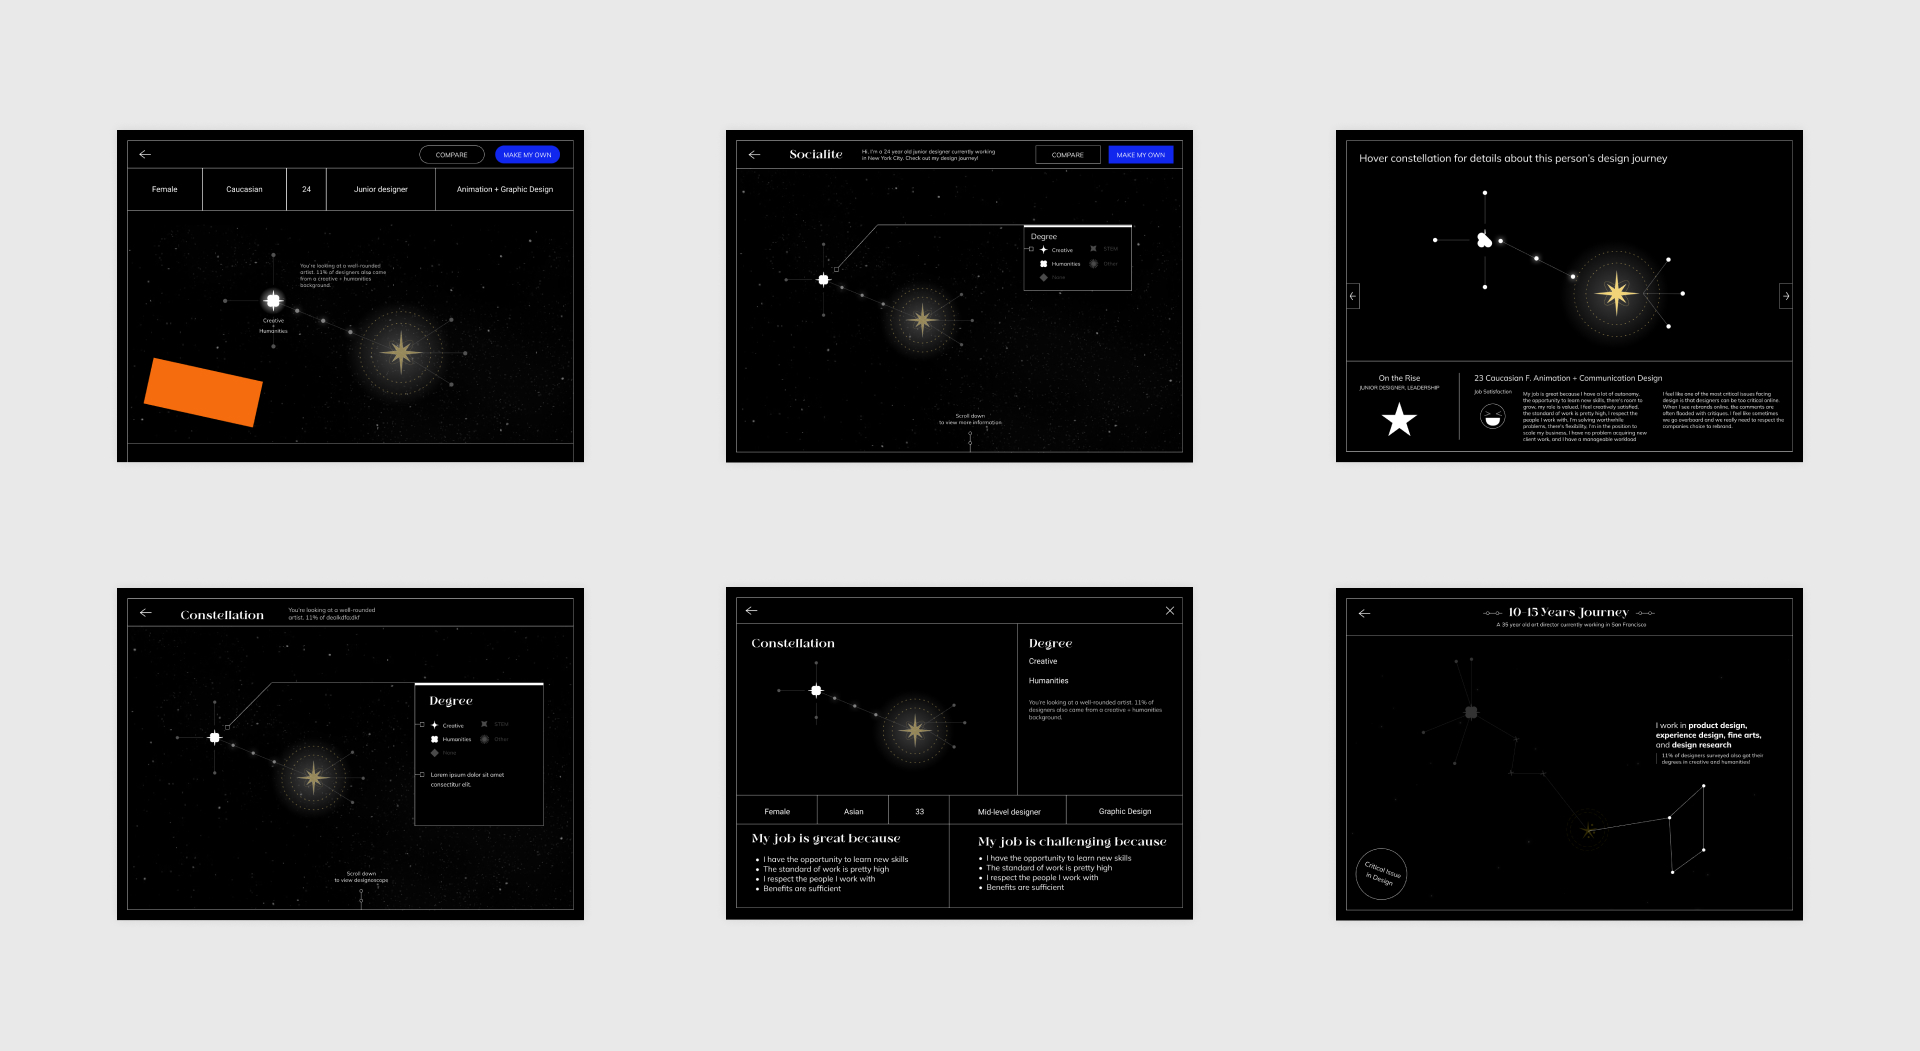
CONSTELLATION MAP
MACRO VIEW OF THE DESIGN CENSUSThe Constellation map allows users to explore career journies—represented by constellations—that make up the Census. Throughout the iterative process, the group considered various layouts that would provide more choices for exploration rather than just presenting every data point as a whole, which can be overwhelming.
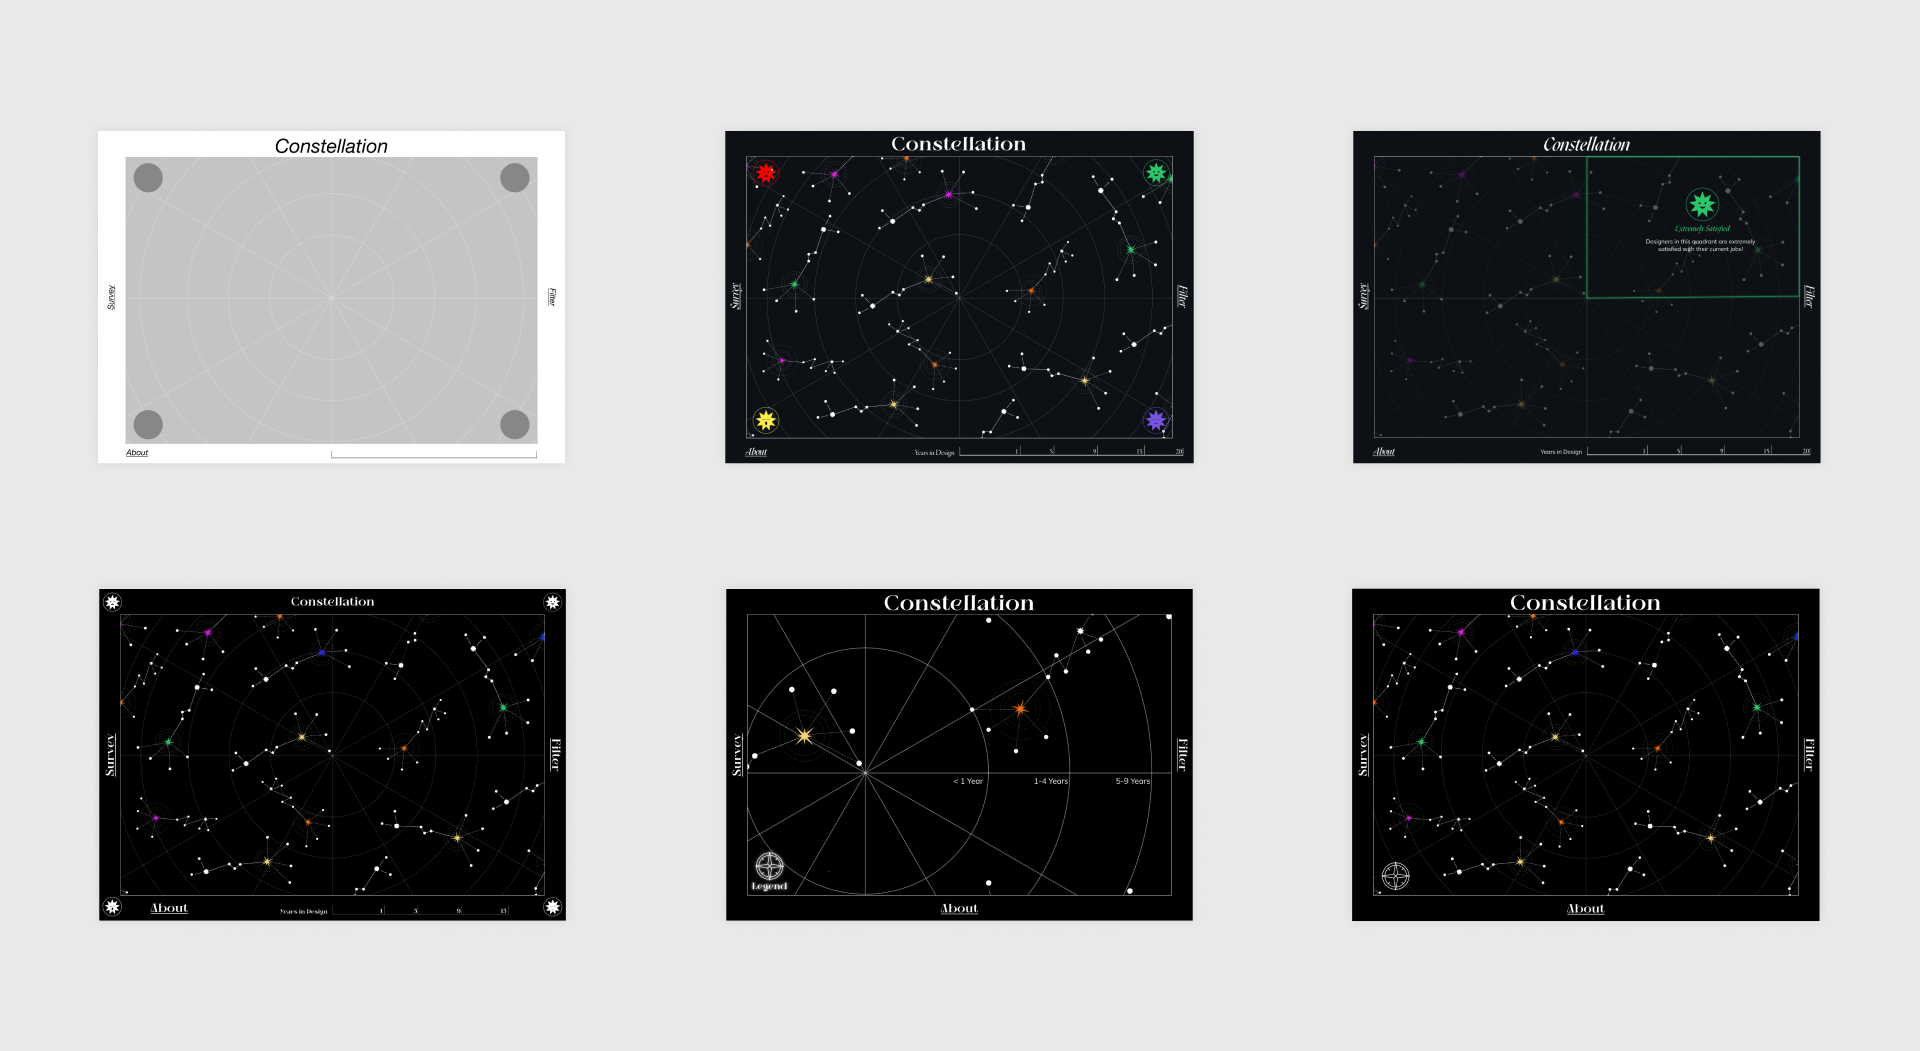
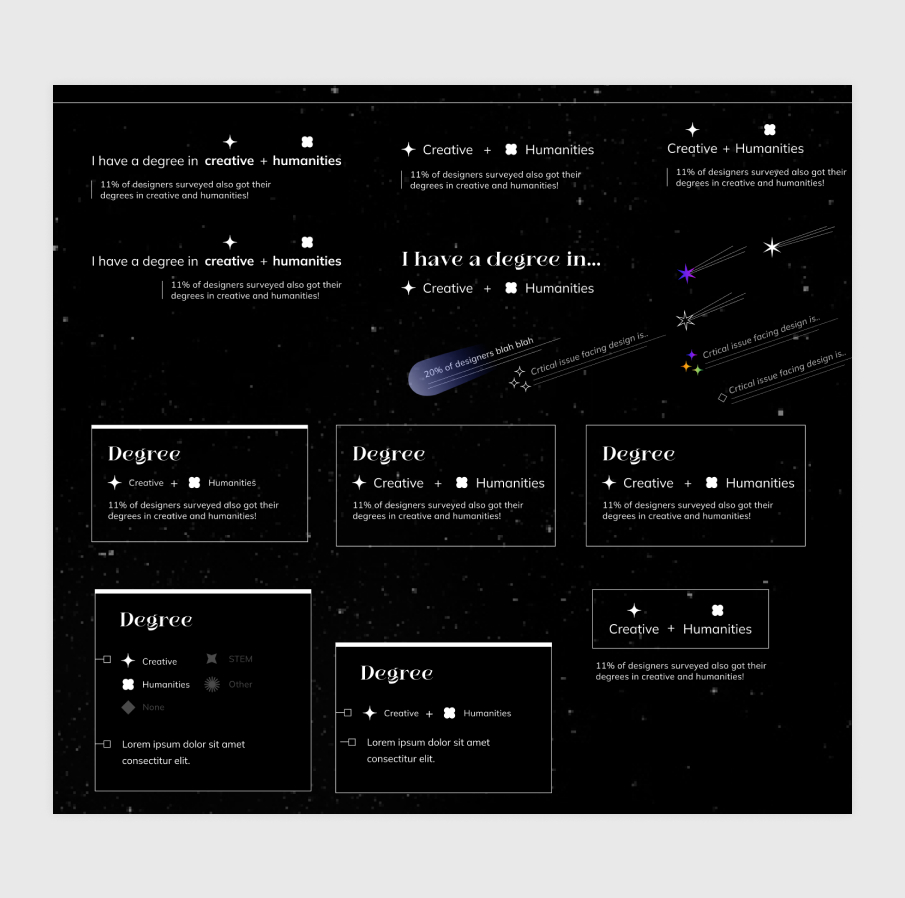
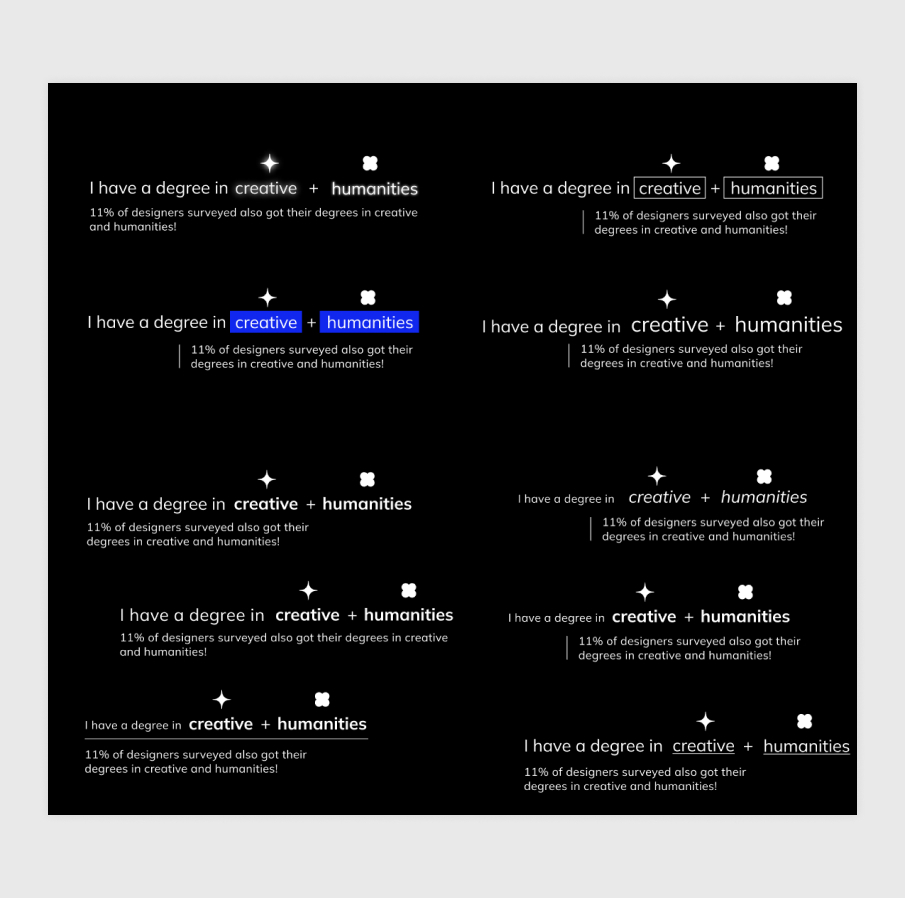
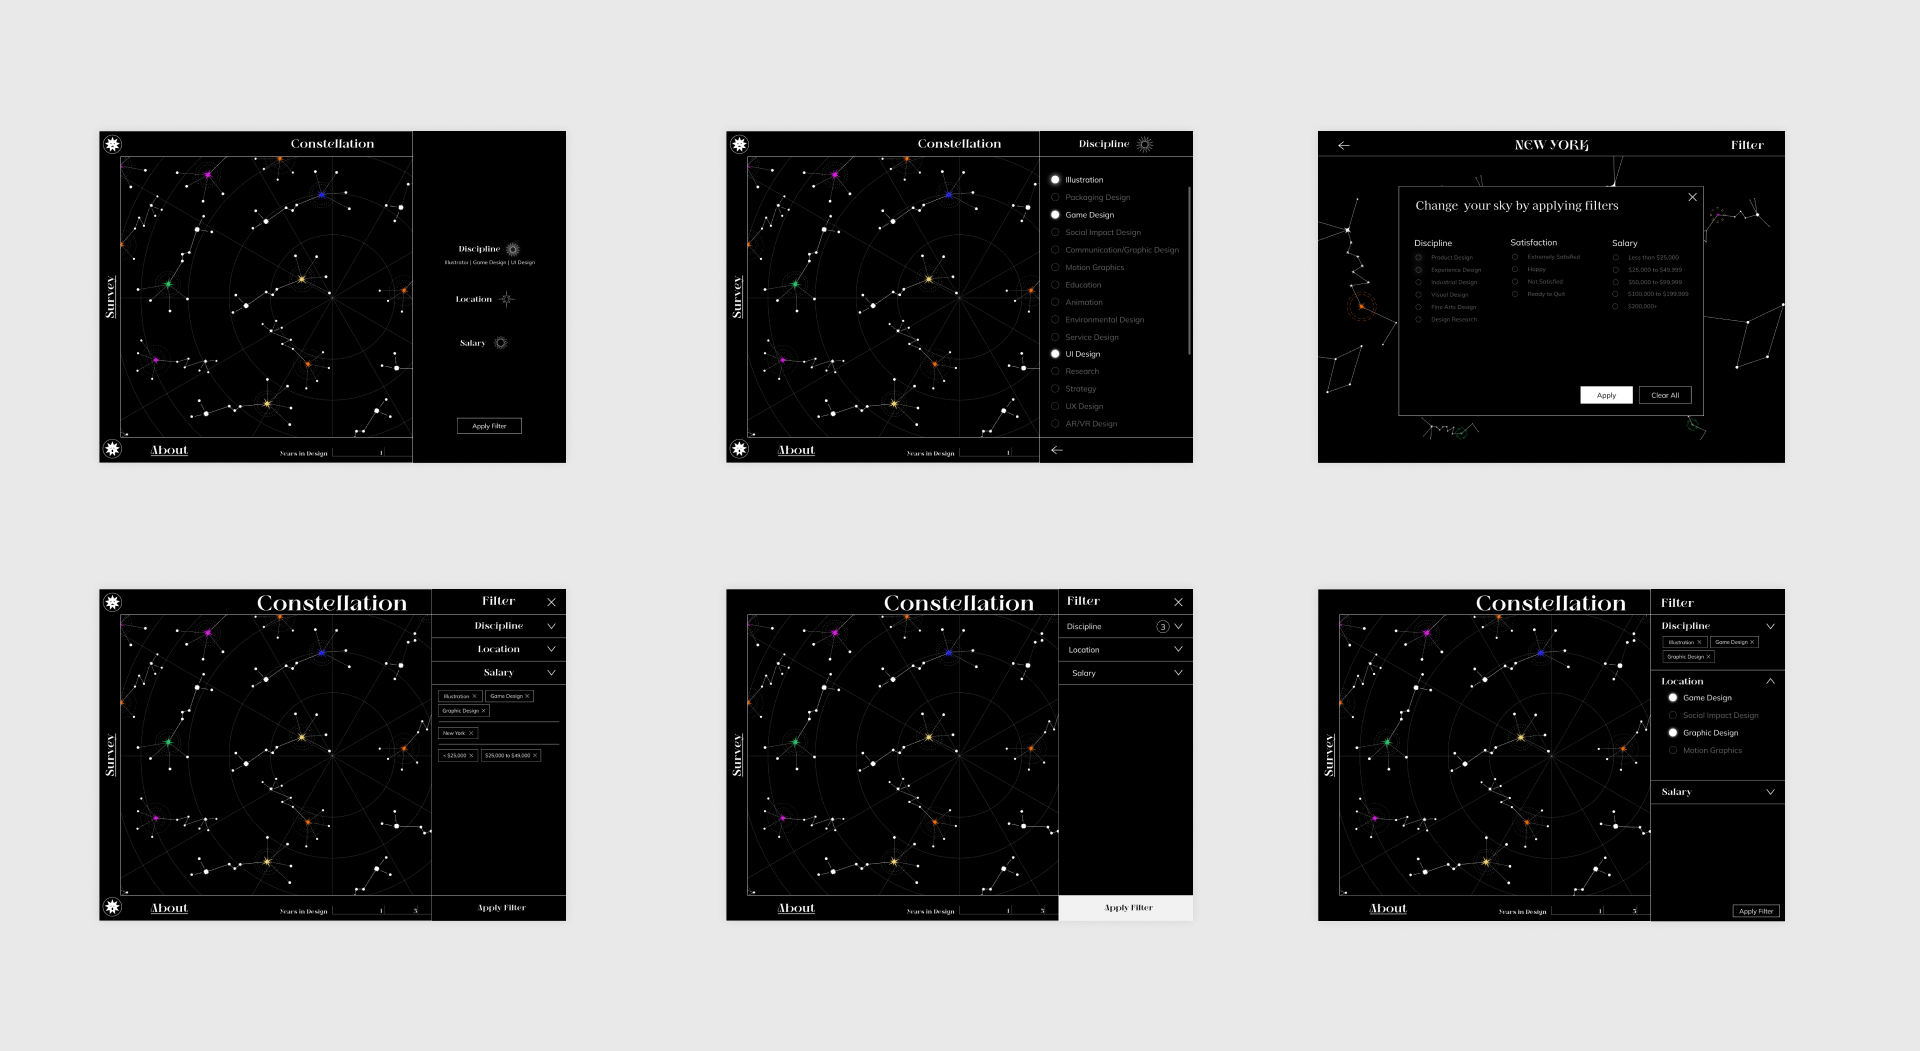
CONSTELLATION FILTER
SIFTING THOUGH DATA POINTSWith the filtering system, users can focus on a specific—or a combination of—facet within the Census that intrigue them. During this process, we looked extensively at companies' career sites and analyzed their filtering systems to inform our design decisions. .
IN-DEPTH EXPLORATION
EXAMINING A SPECIFIC DESIGNER’S PATHMore Documentation Coming Soon...